
IT-Checklists.com - The eBook-Shop with Checklists and Templates for Professionals
logo ITCL
Skip main navigation
Template Systems Operations ManualTemplate Data Centre Operations ManualData Migration ChecklistNonfunctional RequirementsApplication Interface (EAI) Checklist Server Upgrade / Migration ChecklistApplication Upgrade / Migration ChecklistApplication & Server Inventory TemplateRelease ChecklistOutage PlanningApplication RetirementApplication Health checkArchiving RequirementsDisaster Recovery (DR) Technology SelectionBackup OLA / SLADatabase OLA / SLADBA Job DescriptionDatabase Health CheckStandby Database
The author of this template bears following credentials:
OCP 9i Logo
OCP 10g Logo
Logo ITIL green
Application SupportData MigrationOLA / SLA Operations Level AgreementSystem DocumentationProject ManagementDeploymentQuality AssuranceCompliance and StandardsDatabase Administration Non-FunctionalScalabilityRobustnessOperabilityDiagnosabiliyArchivingStart-up PhaseAchieving Operational ReadinessStabilized Operations

Software Diagnosability - Introduction

Software Diagnosability is an important aspect of operability and targets precise and fast identification of problems
  • to minimize interruption of service
  • and maximize availability.
You are operating a business critical application. To support customer's demanded for "High Availability" - or even "Continuous Availability" -
  • All hardware- and network components are redundant.
  • The database operates on an "active/active" or "hot/hot" database cluster.
Indeed, you did spend a lot of money on hardware - and probably even more on hardware-dependent licenses.
However, users are reporting that the application does not respond, or wrong results or wrong error messages.
Unfortunately the Monitoring system does not report anything.
For re-establishing the application service you need
  • to identify (to diagnose) the root cause for application not responding
  • in shortest possible time frame!
Activating debug mode for the complete system resulting in Gigabytes of trace files per minute and severely slowing down the application is not your preferred choice - especially not if activating debug mode requires an application restart.

Software Diagnosability - Requirements

The application shall provide means to diagnose the problems online,
  • without having severe impact on the running system
  • even under high production load.
Ideally you want to activate debug mode / trace mode for exactly one user but across all components (web server, application, database). And that without restarting the complete system.
If customer's support is expected to understand and interpret the output, this will of course require sufficient documentation of the end-to-end request / response flow through the system. Otherwise the application vendor needs to be contacted.
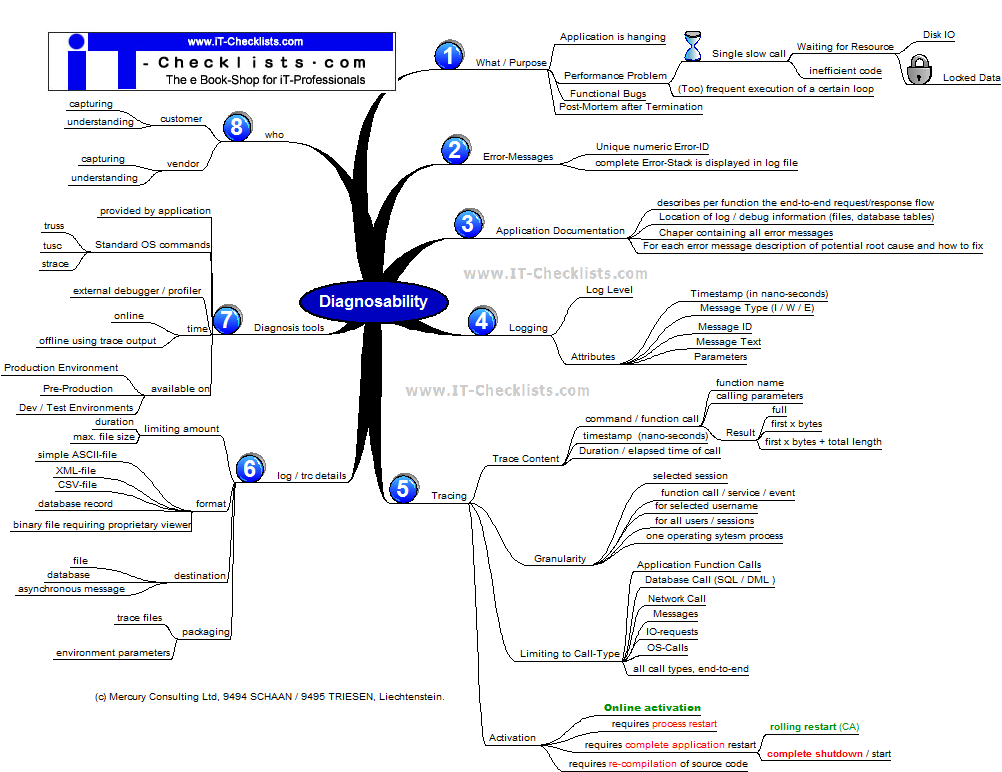
The mind-map below provides a structured presentation of requirements for diagnosis:Zoom picture for better resolution

Mindmap showing attributes for Software Diagnosability

Branch Detail
[1] What / Purpose Application is hanging: Purpose of diagnose is to identify the root cause and fix the problem.
Performance Problem: Mostly not reproducible on a development or test system. Activating extensive trace / debug mode system wide will even increase the performance problem. Therefore details from branch [5] are very important!
Functional Bug: With some luck this can be reproduced on a development or test system, but that's not guaranteed. In case that you can't reproduce it in a development or test system, you need to diagnose the root cause on the production system.
Post-Mortem: A single process or the complete system has terminated before, but system is again up and running. Purpose of the Post-Mortem is to identify the root cause and to derive recommendations to prevent re-occurrence.
[2] Error Messages
  • shall contain a unique Error-Message-ID which is described in the application documentation including typical root causes and solutions
  • shall display the complete error-stack. - In addition to the application-error also all underlying network / middle-ware / database / operating system errors are written to the log-file / error-file. (For security reasons those might not be displayed to the end user, but need to be written to internal log-files.)
[3] Application Documentation
  • shall describe and explain the use of trace-options and diagnosis tools (if provided by application)
  • shall provide instructions for troubleshooting.
  • shall document the complete end-to-end flow of requests through all system components (GUI / Web-page, application server, database server, filesystem, ...)
  • must contain documentation of all error messages including typical root causes and solutions and workarounds.
[4] log / trace details
  • log messages shall be classified by e.g. "Information", "Warning", "Error"
  • shall log at least warnings and errors per default
  • all log messages shall contain a message type id (e.g. E0815 - "Order already exists")
  • log files shall include additional parameters (e.g. order_id) to support troubleshooting
  • log files shall be machine-readable for purpose of monitoring and operational reporting
  • log messages should be structured in a way that allows evaluation by 3rd party "operational intelligence" solutions, which can detect anomalies by reconciling log files from different sources.
  • log files should be readable by humans
  • should contain the option to increase level of logging
[5] Tracing Activating tracing system wide for a large application with thousands of users will result in severe performance impact and huge trace information, making it difficult to find the problem searched for.
  • Granularity: It shall be possible to activate trace mode for only one selected user session, username, service or exactly one process.
  • Call-Type: In case that the area of problem has been already narrowed down, it should be possible to limit tracing only to a certain call type.
  • Activation: Ideally tracing can be enabled and disabled online. A full shut down of entire application is for sure the worst case and not acceptable for an application requiring CA (Continuous Availability) and hardly acceptable for an application requiring HA (High Availability).
[6] log / trace details
  • It shall be possible to limit the amount of trace information, e.g. by time period, or file size.
  • Trace files shall not be overwritten by multiple trace activities.
  • Trace file format shall be suitable for intended users (customer's or vendor's support staff and tools intended to be used to evaluate the log- and trace files.
  • Packaging: In case that trace / debug information is distributed across many files, then automatic packaging for submission to vendor's support will be a helpful feature.
[7] Software Diagnosis Tools
  • If standard tools / operating system commands are not sufficient for detailed diagnosis, the application shall provide diagnosis tools.
  • Standard Operating System Commands like truss, tusc, strace can be helpful, but require both detailed understanding of internals and skills to use those commands. More likely to be used by application vendor's support staff.
  • External Debugger / Profiling Tool
  • time: Used for real-time / online diagnosis, or to analyze a trace file or coredump
  • Which tools are available on production environments needs to be decided individually, considering the availability SLA's versus security and risks of misuse of those tools. Reproducing problems on a development environment may consume significant time.
[8] Who Customer: Tools are documented, customer can use those; However without recurring practising customers support staff might loose valuable time to find the most appropriate options.
Alternatively customer captures detailed trace information, and sends those files to vendor's support for further analysis.
Vendor: Tools are not documented, the vendor will provide commands and parameters to be used based on actual situation.